Figure 2.
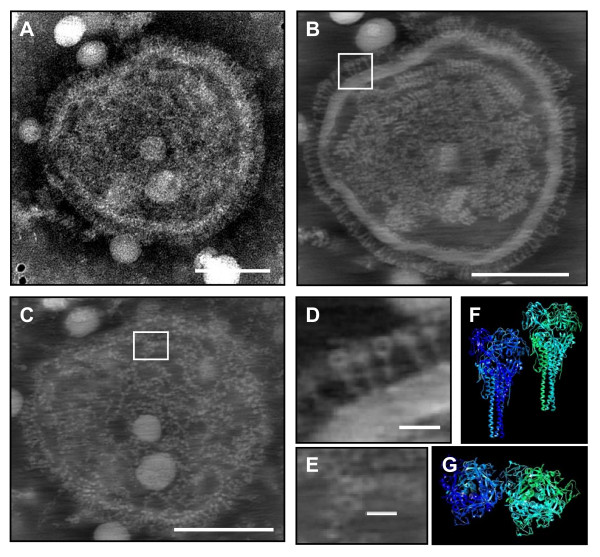
Negative staining and electron tomographic analysis of Newcastle disease paramyxovirus. Figure 2A represents a micrograph of a PTA-stained virion. Figure 2B and C are 44-nm thick digital sections taken along the Z-axis of the tomogram of the virion shown in Figure 2A, taken in the central part (B) and at the level of the envelope (C). Figure 2D and Figure 2E represent the inserts in Figure 2B and Figure 2C, respectively, at higher magnification. Figure 2F and Figure 2G represent side and top views of the 3D ribbon-model of the density map of the F-glycoprotein of Newcastle disease virus. Bar A, B and C: 100 nm, Bar D: 10 nm, Bar E: 8 nm.

