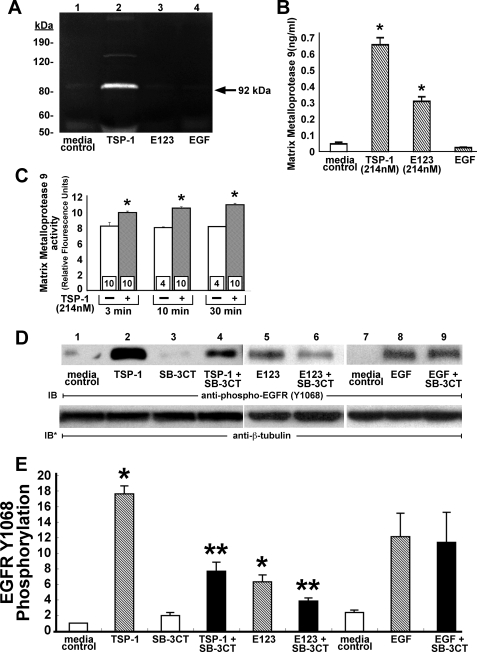
FIGURE 10.
TSP1 activates EGFR through MMP activation. A and B, A431 cells were treated for 24 h with TSP1 (214 nm), E123 (214 nm), EGF (1. 67 nm), or media alone, after which supernatants were concentrated 10-fold through ultrafiltration. A, concentrated supernatants were processed for zymography, after which clear bands against a dark background indicate gelatinase activity. Molecular mass is indicated at left in kDa. B, concentrated supernatants were assayed for MMP9 by ELISA (n = 6). Vertical bars represent mean (±S.E.) MMP9 levels in ng/ml. C, A431 cells were treated for increasing times (3, 10, or 30 min) with TSP1 (214 nm) or media alone, after which concentrated supernatants were incubated for 24 h with a fluorogenic substrate, and the samples were fluorometrically assayed and MMP9 catalytic activity was expressed in mean (±S.E.) relative fluorescence units. n, the number of experiments performed in each group, is indicated within each vertical bar. D and E, A431 cells were exposed for 0.5 h to TSP1 (214 nm), E123 (214 nm), EGF (1.67 nm), or mediaalone in the presence or absence of MMP-2/MMP9 inhibitor SB-3CT(1 μm) and lysed, and the lysates were processed for phospho-EGFR (Tyr(P)-1068) immunoblotting. To indicate protein loading and transfer, blots were stripped and reprobed with anti-β-tubulin antibody. IB, immunoblot; IB*, immunoblot after stripping. The blot is representative of three independent experiments. E, quantitative densitometry of immunoblots in (D)(n = 3). E, vertical bars represent mean (±S.E.) densitometry units. * indicates significantly increased compared with the simultaneous media control at p<0.05.**indicates significantly decreased compared with the TSP1/E123 control at p < 0.05.

