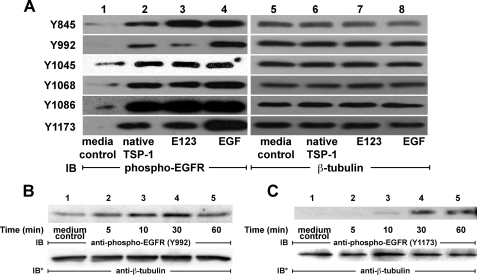
FIGURE 4.
EGFR phosphotyrosine profile in response to TSP1 versus TSP1 EGF-like repeats. A, A431 cells were exposed to EGF (10 ng/ml or 1.67 nm, 10 min), native TSP1 (30 μg/ml or 214 nm, 0.5 h), an equimolar concentration of recombinant TSP1 EGF-like repeats (E123) (3.8 μg/ml or 214 nm, 1 h), or media alone. The cells were lysed and processed for immunoblotting with a series of defined epitope-mapped anti-phospho-EGFR antibodies that recognize Tyr(P)-845, Tyr(P)-992, Tyr(P)-1045, Tyr(P)-1068, Tyr(P)-1086, and Tyr(P)-1173 (lanes 1-4). In other experiments, A431 cells were exposed to a fixed concentration of TSP1 (30 μg/ml or 214 nm) for increasing times, after which the cells were lysed and the lysates processed for phospho-EGFR Tyr-992 (B) and Tyr-1173 (C) immunoblotting. To indicate protein loading and transfer, blots were stripped and reprobed with anti-β-tubulin antibodies (A, lanes 5-8). IB, immunoblot; IB*, immunoblot after stripping. These blots are representative of ≥2 independent experiments.

