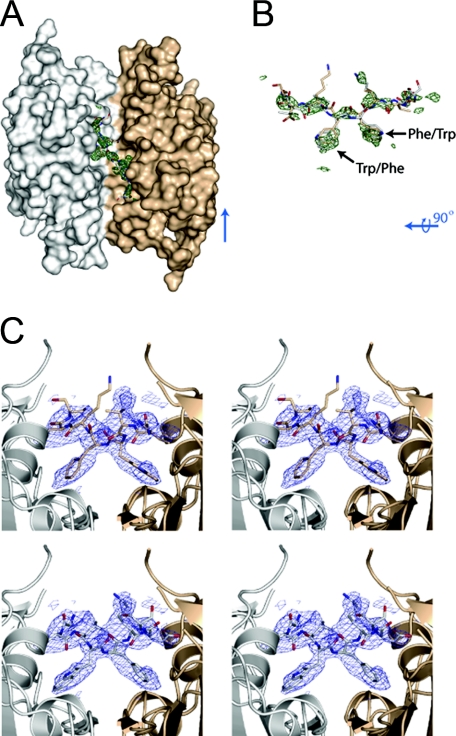
FIGURE 2.
Electron density for residues in the central cavity at the dimer interface. A, surface rendering of the procaspase-1 dimer with electron density Fo - Fc omit map for the area modeled at 50% occupancy. The electron density is contoured at 3σ after refinement and shown in green. For better visibility of the cavity, Arg240 has been removed from the surface rendering. B, residues 291-298 of both chains of caspase-1 within the cavity at the dimer interface are shown along with the Fo - Fc omit map for the area modeled at 50% occupancy. The electron density is shown in green contoured at 3σ. C, stereo view of the electron density 2Fo - Fc contoured at 1σ in the cavity at the dimer interface. The view is oriented lengthwise down the cavity, and the top panels show chain A and the bottom panels show chain B.

