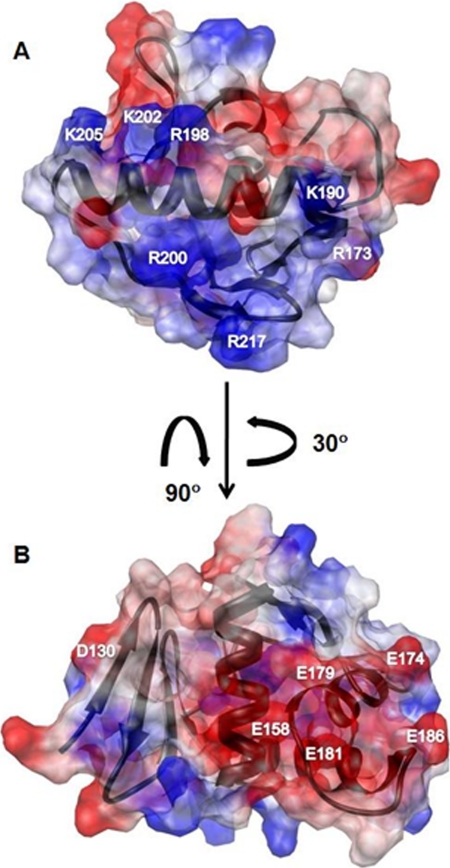
FIGURE 3.
Electrostatic surface potential maps of ArsR-DBD. Red indicates a negatively charged region, blue indicates a positively charged region, and white indicates a neutral or hydrophobic region. A, the molecule is oriented to display the predicted DNA binding surface. Residues contributing to the positive surface potential are Arg-173, Lys-190, Arg-198, Arg-200, Lys-202, Lys-205, and Arg-217. B, the molecule was rotated to reveal a negatively charged surface, attributable to residues Asp-130, Glu-158, Glu-174, Glu-179, Glu-181, and Glu-186.

