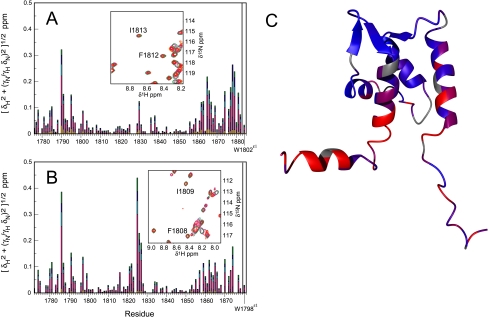
FIGURE 3.
Ca2+ titration of NaV1. 2 (1777-1882) (panel A) and NaV1.5 (1773-1878) (panel B). The plots show joint 1H,15N chemical shift deviations from resonance assignments in 0 mm Ca2+. The titration was performed by serial addition of Ca2+ obtaining the following concentrations: 0 (red), 0.1 (orange), 0.5 (maroon), 1.5 (magenta), 2.5 (cyan), 3.5 (blue), and 4.5 mm (green) for NaV1.2 (panel A) and (0 (red), 0.1 (orange), 0.5 (maroon), 2.5 (magenta), 3.5 (cyan), 4.5 (blue), and 5.5 mm (green) for NaV1.5. Insets show resonances Phe-1812—Ile-1813 and Phe-1808—Ile-1809 for NaV1.2 and NaV1.5, respectively. Titration curves are shown in supplemental Fig. S2. In panel C the joint 1H,15N chemical shift changes for NaV1.2 (1777-1882) at 4.5 mm Ca2+ are mapped onto the lowest energy structure, interpolated between 0 ppm (blue) and 0.1 ppm (red).

