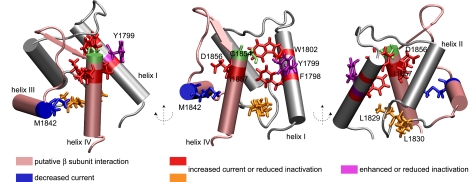
FIGURE 4.
NMR structure of NaV1. 2 (1777-1882) CTD with functionally significant mutations observed in Nav1.1 and Nav1.5 channels. The lowest energy structure of the calculated ensemble is shown. Mutations leading to persistent current cluster in helices I and IV (show in red) and the helix II-III segment (shown in orange), whereas a position (1842) at which mutation (M1852T) leads to decreased current is shown in blue. Position 1799 at which substitutions lead to increased or decreased inactivation is shown in violet, and residue Cys-1854 is shown in green. The putative β subunit interaction site is shown in pink.

