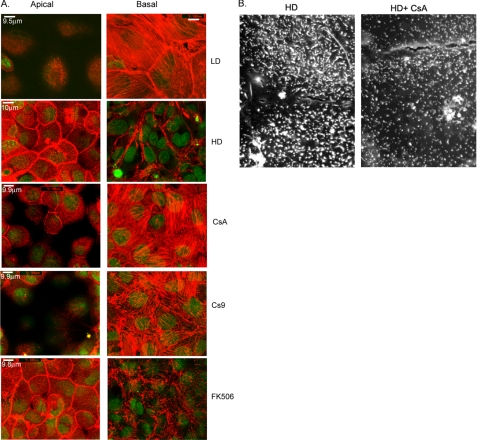
FIGURE 1.
A, projection of three 0.5-μm confocal sections from the apical and basal surfaces of clone C monolayers cultured for 4-5 days under the conditions indicated in the labels (LD, low density; HD, high density; CsA, HD + CsA, Cs9, HD + Cs9; FK506, HD + FK506) and stained with rhodamine-phalloidin (F-actin, red) and SYTOX nuclear stain (green). Carl Zeiss LSM software (version 3.92) was used to obtain size markers, and all size markers are ∼10 μm. B, typical scanning electron microscopic images of clone C monolayers cultured at high density in the absence or presence of 10 μm CsA.

