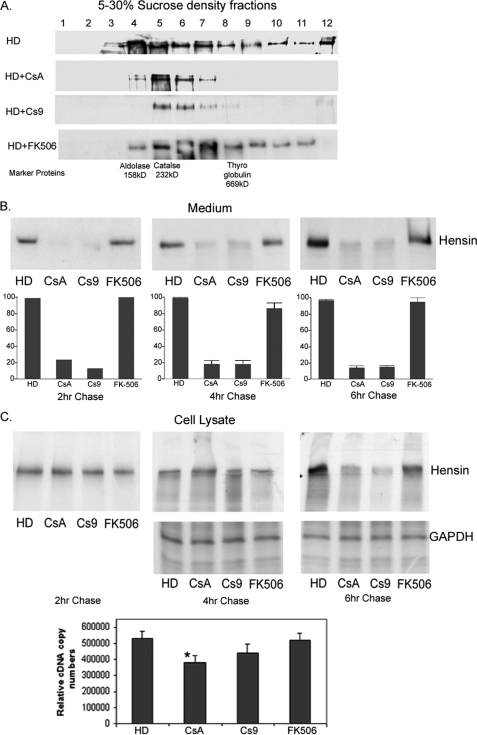
FIGURE 3.
A, anti-hensin immunoblots of various sucrose density fractions of conditioned medium from clone C cells cultured at high density in the absence and presence of PPIase inhibitors CsA and Cs9. A control is cultured in the presence of FK506 (calcineurin inhibitor). The bottom row indicates where the high molecular mass marker proteins localize in the gradient fractions. B, autoradiographs of conditioned medium collected at various time points of chase immunoprecipitated with anti-hensin antibodies. High density cells were cultured in the presence or absence of CsA, Cs9, and FK506 overnight, pulse-labeled with 35S for 2 h, and chased at the indicated times. The bottom panel is a graphical representation of the statistical analysis of densitometric results obtained from three independent experiments (for 4- and 6-h chase). C, autoradiographs of total cell lysates obtained from 35S pulse-labeled cell cultures described above at various time points of chase immunoprecipitated with anti-hensin antibodies (top panel) and with anti-GAPDH antibody (synthesis control, middle panel). The bottom panel shows the relative hensin cDNA copy numbers obtained from quantitative RT-PCR analysis of RNA extracted from clone C cells cultured in the absence or presence of various PPIase inhibitor reagents as indicated in the labels (on left).

