
TABLE 1.
Data collection and refinement statistics
| Oxidized E18D DJ-1 | Oxidized E18Q DJ-1 | |
|---|---|---|
| Data collection | ||
| Space group | P3121 | P3121 |
| Cell dimensions | ||
| a = b, c (Å) | 74.75, 74.80 | 74.77, 74.79 |
| Resolution (Å)a | 30-1.20 (1.24-1.20) | 30-1.15 (1.18-1.15) |
| Rmergeb | 0.066 (0.640) | 0.092 (0.379) |
| <I>/<σ(I)> | 32.0 (3.7) | 25.7 (6.9) |
| Completeness (%) | 99.8 (100) | 99.8 (100) |
| Redundancy | 9.9 (9.5) | 10.0 (9.8) |
| Refinement | ||
| Resolution (Å) | 30-1.20 | 30-1.15 |
| No. of reflections | 75,731 | 85,756 |
| Rwork; Rwork for Fo > 4σ(Fo) (%)c | 12.2; 11.0 | 11.6; 10.0 |
| Rfree; Rfree for Fo > 4σ(Fo) (%)d | 15.5; 14.2 | 14.5; 13.6 |
| Rall; Rall for Fo > 4σ(Fo) (%)e | 12.4; 11.1 | 11.6; 10.0 |
| No. of atoms | ||
| Protein | 1458 | 1439 |
| Water | 261 | 288 |
| Beq factors (Å2) | ||
| Protein | 15.0 | 16.6 |
| Water | 34.9 | 32.6 |
| Root mean square deviations | ||
| Bond lengths (Å) | 0.014 | 0.015 |
| Bond angle 1-3 distances (Å) | 0.030 | 0.030 |
a
Values in parentheses are for the highest resolution shell.
b
Rmerge =
 , where i is the
ith observation of a reflection with indices, h, k,
and l, and angle brackets indicate the average over all i
observations.
, where i is the
ith observation of a reflection with indices, h, k,
and l, and angle brackets indicate the average over all i
observations.
c
Rwork =
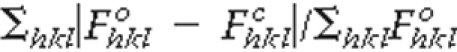 , where
 is the calculated structure factor
amplitude with indices h, k, and l.
is the calculated structure factor
amplitude with indices h, k, and l.
d
Rfree is calculated as Rwork, where
the  values are taken from a test set
comprising 5% of the data that were excluded from the refinement
(25).
values are taken from a test set
comprising 5% of the data that were excluded from the refinement
(25).
e
Rall is calculated as Rwork, where
the  values include all measured data
(including the Rfree test set).
values include all measured data
(including the Rfree test set).