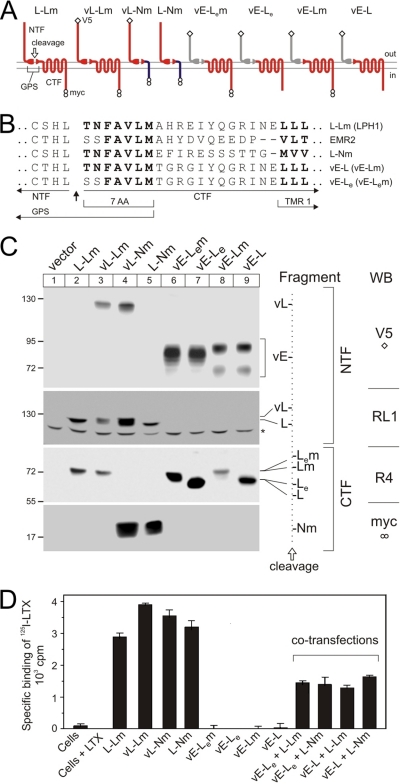
FIGURE 1.
Design and expression of chimerical constructs. A, a diagram of the structural features and membrane topography of the chimerical constructs employed in this work. Letters and colors in the diagrams identify protein sequences from latrophilin 1 (L, red), α-neurexin (N, dark blue), or EMR2 (E, gray) (see also text). Split oval, cleaved GPS domain, whose C-terminal portion (seven amino acids, 7AA) can be from latrophilin (red) or EMR2 (gray, subscript e). Open diamond, V5 epitope; two circles, double-Myc epitopes. B, amino acid structures of the fusion proteins near the cleavage site. Dashes have been introduced for better alignment of the transmembrane domains (TMR1). C, Western blotting (WB) of NB2a cells stably expressing the fusion proteins as shown above. Antibodies used are specified on the right-hand side of the panel and described under “Materials and Methods.” Cells were produced and selected, grown in serum-free medium for 48 h, harvested, and extracted with Triton X-100 (see “Materials and Methods”). Extracts were separated in four equally loaded 6-12% SDS-polyacrylamide gels, transferred onto a polyvinylidene difluoride membrane, and the resulting blots were stained with antibodies indicated on the far right. The positions and molecular masses of protein markers are shown on the left. The identities of the fragments are explained on the right. Dotted line, cleavage position, separating the NTFs (left) and CTFs (right). Asterisk, a protein band stained nonspecifically with RL1. D, specific binding of LTX by NB2a cells stably expressing individual or co-transfected constructs (as specified below). Cells, prepared as in C, were incubated with 1 nm 125I-LTX and washed by centrifugation, and bound radioactivity was determined in a γ-counter. Nonspecific binding was measured in the presence of 100 nm LTX (Cells+LTX) and subtracted from the total binding values.

