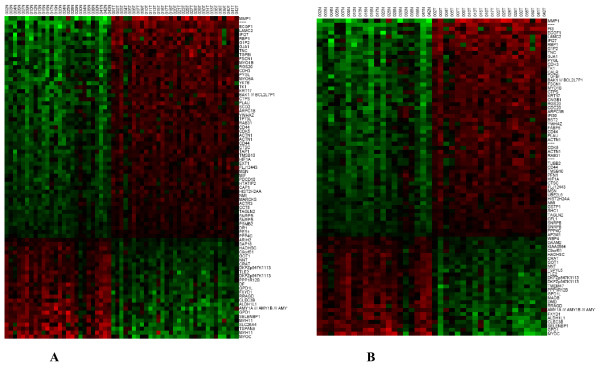
Figure 1.
Hierarchical clustering of the gene expression data for the TN cluster set, N = 37. A; and the TN paired cluster set, N = 20. B. Approximately 12, 625 genes were clustered using the method described in the text. The genes shown represent the top 80 genes that were up-regulated (red) and down-regulated (green) in the sample sets. The normal tissue (N) and tumor tissue (T) are followed by their corresponding case numbers.

