
Figure 8.
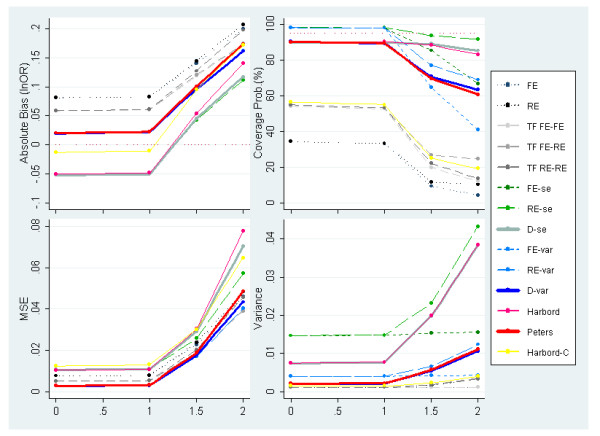
Measures of absolute bias, coverage probabilities, MSE and variance of the predicted effect for meta-analyses simulated to have 30 studies, an underlying OR = 1 (lnOR = 0) and severe PB induced by effect size alongside increasing heterogeneity (PB situation 4).