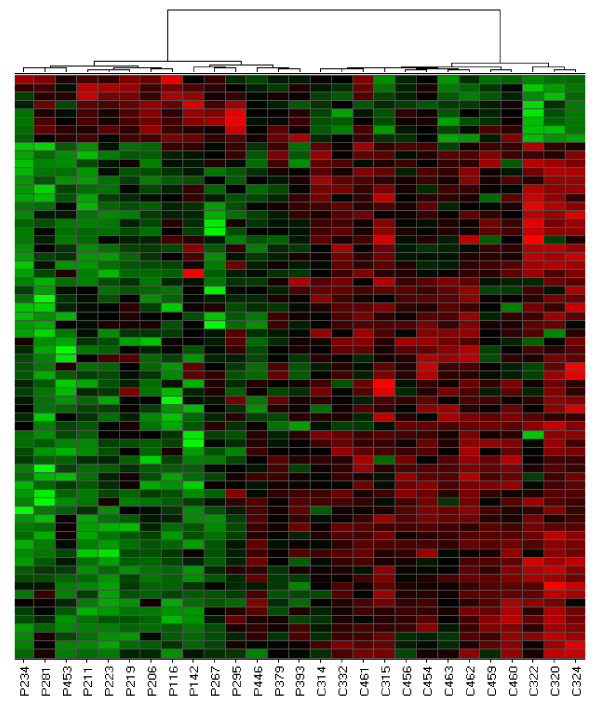
Figure 1.
Hierarchical cluster analysis derived from gene expression profiling in neutrophils of children with active polyarticular JIA and neutrophils from control children. Clustering was performed using Ward's method which clustered on both the samples and the genes. Control samples are designated by the prefix "C", patient samples are designated "P". Each column represents patterns of genes from a separate sample, indicated by different numbers. Each row represents a separate gene. Red: genes that are over-expressed in disease; green: genes that are under-expressed in disease.

