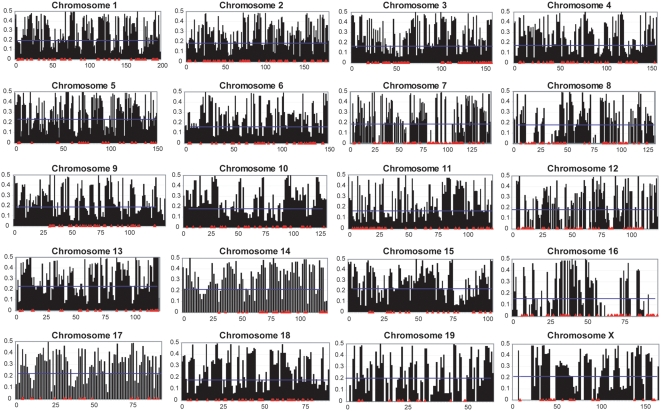
Figure 1. Chromosomal distribution of MAFs.
For each chromosome, chromosomal position in Mb is shown on the X-axis, and MAF is plotted on the Y-axis. MAF values for individual SNPs are shown in black, the blue line represents mean MAF for each chromosome, and locations of monomorphic SNPs are in red.

