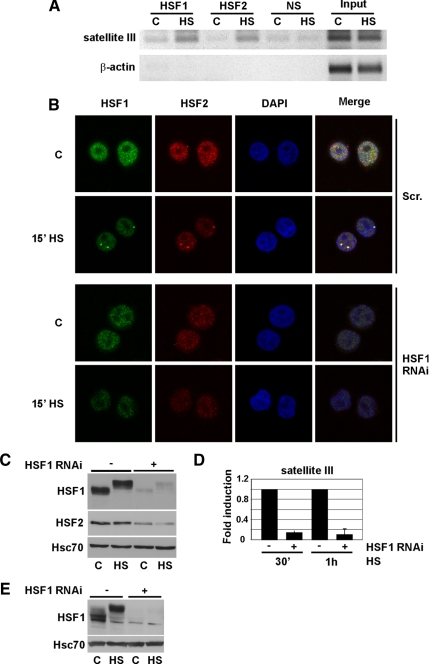
Figure 1.
Stress-induced localization of HSF2 into the nSBs is HSF1 dependent. (A) HSF1 and HSF2 binding to sat III in untreated (C) and 1-h heat-shocked (HS) K562 cells was analyzed with ChIP. β-actin was used as a control promoter. Input represents 1% of the total material and a nonspecific antibody (NS) was used as a negative control. The ChIP assay on sat III was performed on four biological samples. (B) HSF1 was down-regulated in HeLa cells (HSF1 RNAi) and the nSB formation followed by staining of HSF1 (green) and HSF2 (red). As a control, a scrambled cell line (Scr.) was used. Note that the settings used for image acquisition of HSF1 and HSF2 in Scr. cells were reused for HSF1 RNAi cells. For staining, polyclonal and monoclonal antibodies were used against HSF1 and HSF2, respectively. The nucleus is shown in blue by staining of DNA with DAPI. Heat shock and control are indicated as HS and C, respectively. For additional time points, see Supplemental Figure 2A. (C) Western blot analysis of HSF1 and HSF2 in the stable Scr. (−) and HSF1-RNAi (+) cell lines. The retarded mobility of HSF1 in heat-shocked (HS) samples is due to hyperphosphorylation (Sarge et al., 1993). Hsc70 serves as a loading control. (D) Real-time RT-PCR analysis of sat III transcription in Scr. (−) and HSF1-RNAi (+) cells. The results are shown as fold induction upon 30 min and 1 h of HS. Fold induction was calculated by comparing the induction in HSF1 RNAi samples to the induction in scrambled samples, which were arbitrarily set to 1. The data represent three biological samples, and relative quantities of sat III RNA were normalized to GAPDH. Error bars indicate SD. (E) Western blot analysis of HSF1 down-regulation in HEK293T cells. HS indicates a 1-h heat shock.

