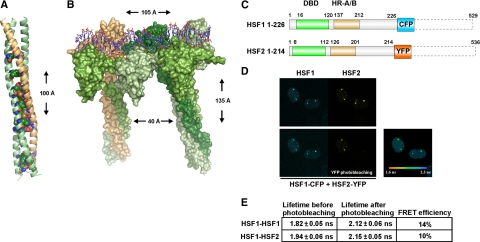
Figure 2.
HSF1 and HSF2 interact as DNA-bound heterotrimers. (A) Structural model of a heterotrimer formed by the HR-A/B domains of two HSF1 molecules (green) and one HSF2 molecule (beige). The conserved amino acids found at positions a and d in the heptad repeat (see Supplemental Figure 3) are shown as spheres. (B) Surface representation of the structural model of an HSF1-HSF2-HSF1 heterotrimer and an HSF1 homotrimer bound to DNA. HSF2 is colored beige and the different HSF1 molecules are colored in different shades of green. The HSF trimers are separated on DNA by two nucleotides as in a consensus HSE. The height and width of the complex as well as the distance between the two coiled coils are indicated. (C) Schematic presentation of the HSF1 and HSF2 C-terminal deletion constructs used for FRET. The position of amino acids is shown, and the DNA-binding domain (DBD) and trimerization domains HR-A/B are indicated. The deleted C-terminal regions are illustrated by dashed lines. (D) Interaction between HSF1 and HSF2 on DNA in the nSBs was detected with FLIM-FRET on live cells. HeLa cells were transfected with C-terminal HSF1 and HSF2 deletions fused to CFP and YFP, and the fluorescence lifetime of the donor (HSF1-CFP) was measured before or after photobleaching of the acceptor (HSF2-YFP). The fluorescence lifetime after photobleaching of the acceptor is indicated by a color scale bar. (E) A mean FLIM-FRET efficiency was calculated for the FRET pairs HSF1-CFP − HSF1-YFP and HSF1-CFP − HSF2-YFP. The data for each experimental condition represents measurements from at least five cells, and the SD is indicated.

