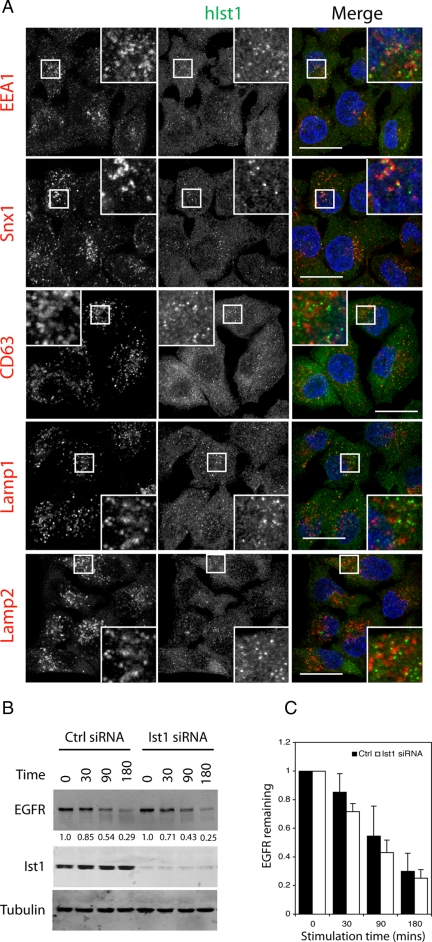
Figure 4.
Analysis of hIST1's function in endosomal sorting. (A) Endogenous hIST1 (pseudocolored in green, middle column) and the indicated endosomal markers (pseudocolored in red, left column) were studied by immunofluorescence. A higher magnification of the boxed areas is shown in all panels, and DNA is shown in blue. Bar, 10 μm. (B) HeLa cells treated with either nonspecific control or hIST1-specific siRNA were serum starved and stimulated for the indicated times with EGF. Lysates were analyzed with α-EGFR, α-hIST1, and α-tubulin. (C) Graphic representation of the quantification obtained via infrared imaging after immunoblotting with α-EGFR. Error bars indicate the SD from the mean of triplicate measurements.

