Figure 8.
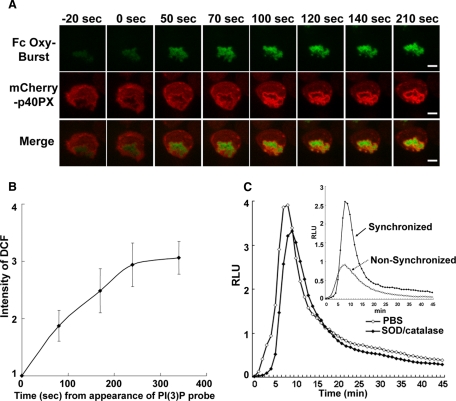
Activation of the NADPH oxidase in Fc OxyBURST phagosomes. (A) Superoxide production was monitored in individual phagosomes after the addition of Fc OxyBURST to PLB-985 neutrophils expressing mCherry-p40PX. The green and red fluorescence represent DCF (a probe for H2O2) and mCherry-p40PX, respectively. The frames are labeled in seconds with respect to the time at which closure (sealing) of the phagosome was observed, with time zero being the time of closure. (B) The relative intensity of DCF fluorescence in five phagosomes from three independent experiments was analyzed with Image J software. The intensity of DCF was considered as 1.0 at the time at which mCherry-p40PX first appeared on internalized phagosomes and is shown over time (s) after the appearance of the mCherry-p40PX probe. (C) Phagosome superoxide production induced by Fc OxyBURST was measured for 46 min by chemiluminescence in the presence of 20 μM luminol, with or without SOD and catalase. The inset shows the intracellular phagosome superoxide production measured for 46 min in PLB-985 cells expressing mCherry-p40PX, using nonsynchronized (as described in Figure 2D) or synchronized phagocytosis method, as indicated.

