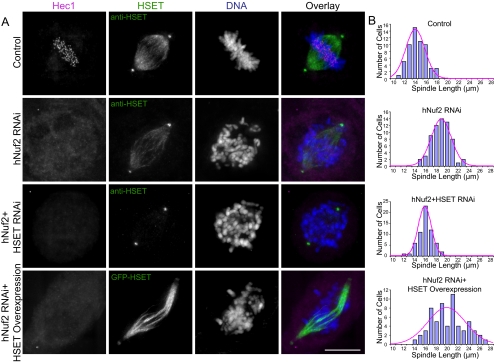
Figure 2.
HSET affects spindle morphology in spindles lacking K-fibers. (A) Control HeLa cells (top three rows) or GFP-HSET overexpressing HeLa cells (bottom row) were transfected with either control Luciferase, hNuf2, or hNuf2+HSET siRNAs, synchronized, released, and then processed for immunofluorescence. In each panel, the Hec1 (magenta), HSET (green,) and DNA (blue) staining are shown. Scale bar, 10 μm. (B) Histograms of pole-to-pole distances quantified from a total of 60 spindles in three independent experiments for each knockdown condition. The best fit Gaussian distribution is shown superimposed in magenta. Average spindle lengths: control, 14.0 ± 0.4 μm; hNuf2 RNAi, 18.3 ± 0.5 μm; hNuf2 + HSET RNAi, 15.5 ± 0.6 μm; and hNuf2 RNAi + HSET overexpression, 19.7 ± 0.4 μm.

