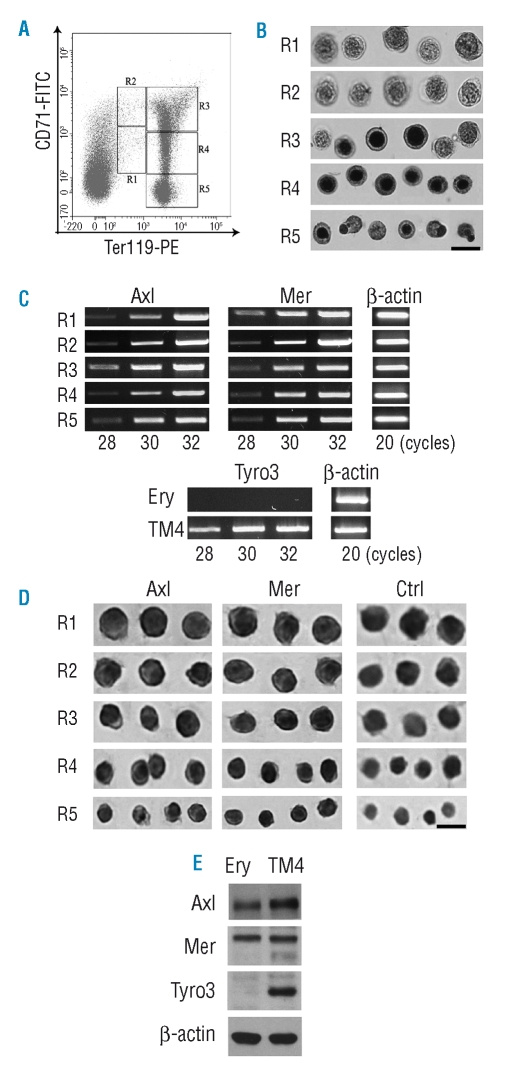
Figure 1.
Expression of TAM receptors in erythroid cells. (A) FACS density plots of bone marrow erythroid cells. After staining for Ter119 and CD71, the erythroid cells of mouse bone marrow can be distinguished into five distinct populations (R1 to R5) by flow cytometry. (B) The five populations of erythroid cells were sorted by a FACS instrument. The characteristics of the sorted R1 to R5 cells were evaluated by staining with benzidine and their morphology. Representative cells from more than one field are shown. Scale bar = 10 μm. (C) Analysis of the expression of TAM receptors by RT-PCR. Different numbers of PCR cycles were performed to ensure a range of linear amplification. The TM4 cell line was used as a positive control for Tyro3 expression. β-actin was used to control the quality of RNA. (D) Immunocytochemistry for Axl, Mer and Tyro3 proteins on the five populations of erythroid cells. Tyro3 protein was not detected in erythroid cells (data not shown). Representative cells are shown in each region. Scale bar = 10 μm. (E) Western blotting analysis of Axl, Mer and Tyro3 in bone marrow erythroid cells (Ery). TM4 cells were used as controls, and β-actin was used to monitor the loading of samples.

