
Figure 7.
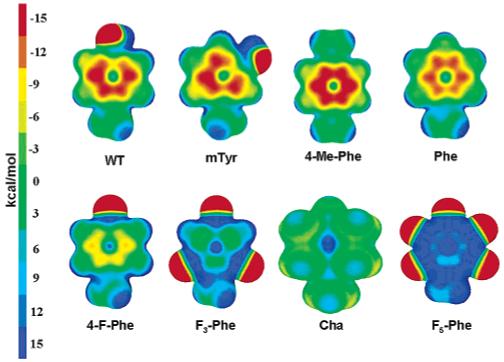
Electrostatic potential for Tyr234 as modeled in Models D and E and its mutations mapped onto an electronic density isosurface of 0.01 e/Å3. Red indicates negative potential, while blue indicates positive potential.
Official websites use .gov
A
.gov website belongs to an official
government organization in the United States.
Secure .gov websites use HTTPS
A lock (
) or https:// means you've safely
connected to the .gov website. Share sensitive
information only on official, secure websites.
Electrostatic potential for Tyr234 as modeled in Models D and E and its mutations mapped onto an electronic density isosurface of 0.01 e/Å3. Red indicates negative potential, while blue indicates positive potential.