Figure 5.
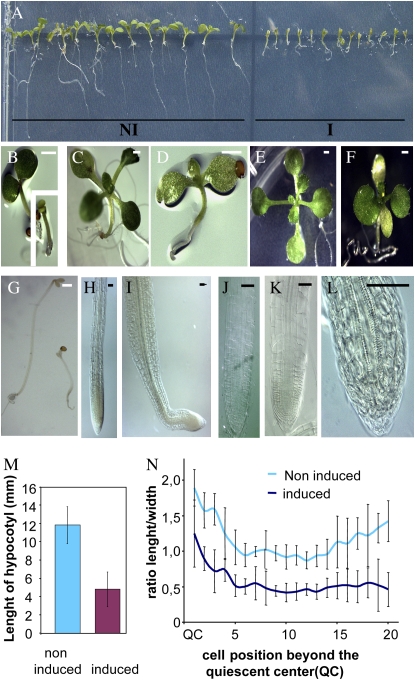
The modified protein AtTCP20∷VP16 disrupts growth by reducing cell elongation. A, Nine-day-old induced plants (I) and 9-d-old noninduced plants (NI). B, Five-day-old noninduced plant; the inset shows a 5-d-old induced plant. C, Eleven-day-old noninduced plant. D, Eleven-day-old induced plant. E, Seventeen-day-old noninduced plant. F, Seventeen-day-old induced plant. G, Five-day-old seedlings grown in the dark: on the left is a noninduced seedling, and on the right is an induced seedling. B to G: Bar = 1 mm. H and I, Three-day-old primary root tip in noninduced (H) and induced (I) conditions. J and K, Ten-day-old primary root tip in noninduced (J) and induced (K) conditions. L, Twenty-day-old primary root tip in induced conditions. H to L: Bar = 50 μm. M, Hypocotyl lengths of 5-d-old dark-grown seedlings under induced or noninduced conditions. Each bar represents the average ± sd of 20 noninduced hypocotyls and 28 induced hypocotyls. N, The ratio of length to width of the first 20 cells located upstream of the quiescent center of roots of 10-d-old noninduced and induced plants. To calculate this ratio, median lengths and median widths of cells of five noninduced and seven induced roots were used. The vertical bars represent sd.

