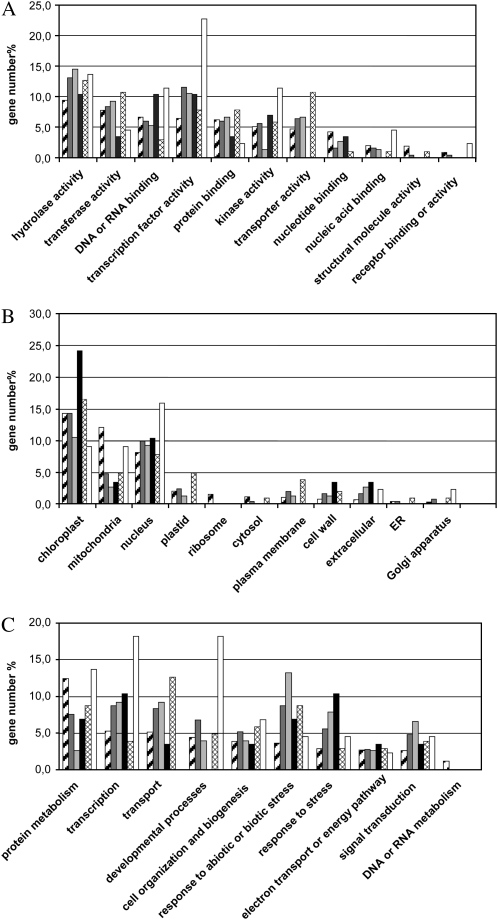
Figure 8.
Bar graph representation of gene functional classifications based on Gene Ontology at TAIR. Classification was performed according to keyword category (A, molecular function; B, cellular component; C, biological process), and the gene number percentage of each category is shown as a hatched bar for the whole genome, as a dark gray bar for 252 repressed genes, as a light gray bar for subset 1, as a black bar for subset 2, as a cross-hatched bar for subset 3, and as a white bar for subset 4.

