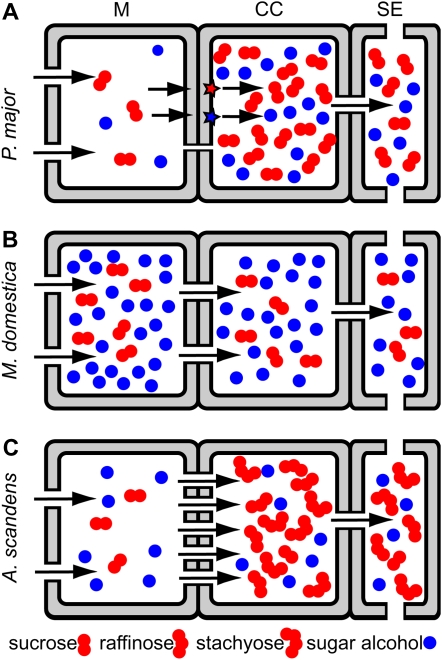
Figure 4.
Schematic diagrams of hypothetical phloem-loading schemes. Relative concentrations of Suc and sugar alcohol are represented in mesophyll cells, CCs, and SEs. Solutes pass between cells through plasmodesmata (gaps in walls) or are transferred into the apoplast and are pumped into CCs by transporters (red and blue stars). A, Apoplastic loading of both sugar alcohol and Suc. B, Symplastic loading of both sugar alcohol and Suc, driven by their respective concentration gradients. C, Symplastic loading of sugar alcohol and Suc into intermediary cells, where Suc is converted into raffinose and stachyose. [See online article for color version of this figure.]

