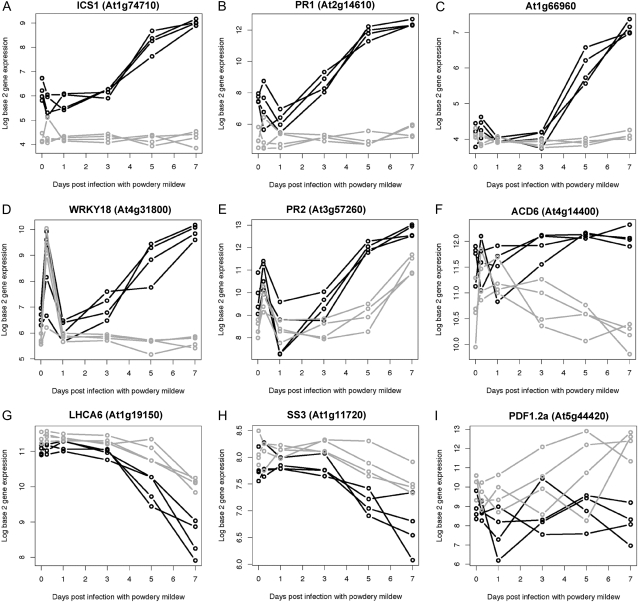
Figure 3.
Patterns of ICS1-impacted transcriptional responses. Gene expression profiles for the wild type (black) and ics1 mutant (gray) over the time course of PM infection from 0 (UI) to 7 dpi. Expression profiles for four paired (wild-type and mutant) biological replicates are shown for members of each ICS1 cluster: cluster 1 (A–D), cluster 2 (E), cluster 3 (F), cluster 4 (G), cluster 5 (H), and cluster 6 (I).

