Figure 5.
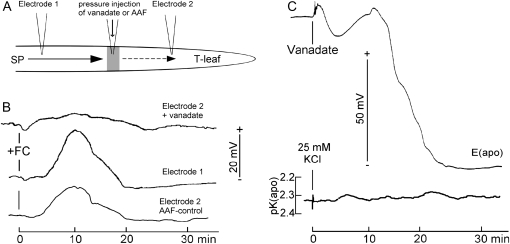
Responses to FC and orthovanadate. A, Principle of testing the effect of 1 mm orthovanadate on the FC effect. Part of the T-leaf (shaded area) was pressure injected with the vanadate (dissolved in AAF). Capillary forces made the solution spread through the apoplast. Electrode 1 picked up the FC signal before the vanadate zone, and electrode 2 picked up the signal behind it. In a control experiment, the leaf was injected with AAF only and the FC effect was measured at electrode 2. B, FC (1 μm) added to a cut-injured leaf of H. vulgare caused a hyperpolarizing voltage transient on the T-leaf (electrode 1). Orthovanadate (1 mm) inhibited the signal propagation to electrode 2, while AAF left it almost unaffected. C, Voltage response to 1 mm orthovanadate added to an S-leaf injured by cutting and measured at the T-leaf. In the inset, to test for a possible mass flow from the S-leaf to the T-leaf, 25 mm KCl was added to the cut wound at the S-leaf and K+ activity was measured at the T-leaf. Representative kinetics of at least three equivalent experiments each are shown. The distance of stimulus to electrodes on the T-leaf was about 25 cm for electrode 1 and about 30 cm for electrode 2. E(apo), Apoplastic voltage.

