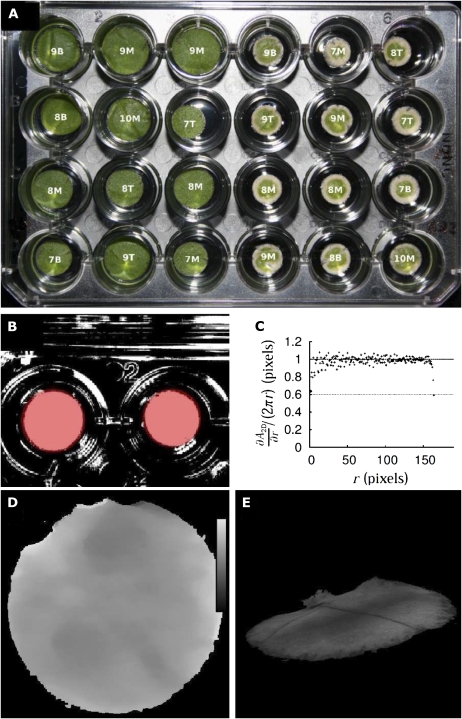
Figure 2.
Examples of resulting images. A (left), Leaf discs treated with NS (nutrient solution). A (right), Leaf discs treated with HG (glyphosate at high concentration). Images were taken 72 h after the beginning of treatment. B, Binary mask Mt obtained by gray level segmentation (white, foreground; black, background); superimposed (red) are leaf disc circles as detected by computing ∂A2D/∂r. The final segmentation mask Ms contained those pixels of Mt closer than r to the centroid of the detected leaf disc and that had the value 1 in Mt. C, ∂A2D/∂r versus r. Points show measured increase; the dashed line shows theoretical increase, 2πr. D, Regularized and masked disparity map; the bar indicates the disparity range: 610 to 620 pixels. E, 3D view of a leaf disc. All depicted leaf discs are from tobacco.

