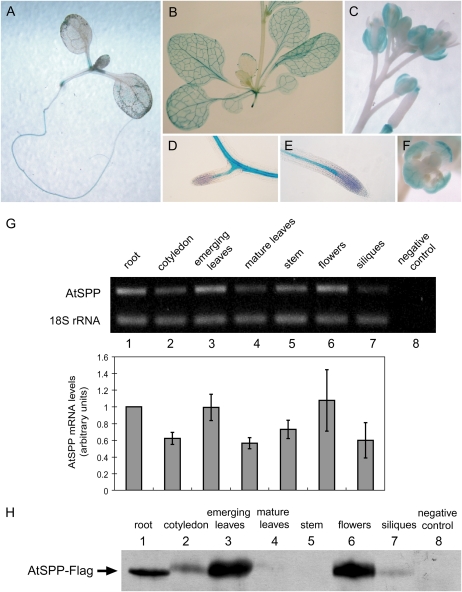
Figure 2.
Expression pattern of AtSPP. A to F, Expression of a transcriptional fusion of the GUS reporter gene to the promoter of AtSPP. A, One-week-old seedling. B, Rosette and stem of a 3-week-old plant. C, Inflorescence. D, Lateral root of a 1-week-old plant. E, Primary root tip of a 1-week-old plant. F, Open flower. G, Semiquantitative RT-PCR analysis of AtSPP transcript abundance. The ratio of AtSPP transcript over 18S rRNA in RT-PCR of each tissue was normalized against the average ratio in root samples and plotted using arbitrary units. Each bar represents the mean and sd of three replicates. H, Expression pattern of AtSPP-Flag in Col-0 plants transformed with AtSPP-Flag expressed from its native promoter. Total protein (20 μg per lane) was extracted from various organs of a single-copy transgenic line (n = 2) and subjected to immunoblot analysis using an anti-Flag monoclonal antibody. An extract from flower buds of untransformed plants (wild type) was used as the negative control (lane 8).

