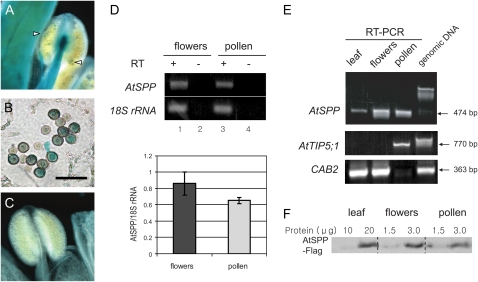
Figure 4.
Expression of AtSPP in male gametophyte tissues. A to C, Photomicrographs of anthers from stage 12 to 13 (Smyth et al., 1990) flowers of wild-type (C) or AtSPP-GUS (A and B; white arrowheads) plants. A cross-section image of a paraffin-embedded anther of the AtSPP-GUS plant is shown in B. Bar = 50 μm. D, Semiquantitative RT-PCR analysis of AtSPP transcript abundance in flowers or pure pollen from wild-type plants at the same stage of flower development. Transcript abundance was normalized by measuring the ratio of AtSPP transcript to 18S rRNA. Each bar represents the mean and sd of three replicates. E, RT-PCR analysis of AtSPP transcript abundance in leaf, flower, and pollen relative to the pollen-specific transcript, AtTIP5;1, and a transcript not expressed in pollen, CAB2. F, Comparison of the expression levels of AtSPP-Flag in leaves, flowers, and pure pollen of transgenic plants. Two-fold serial dilutions of total protein extracts from leaves, flowers, and pure pollen were immunoblotted using an anti-Flag monoclonal antibody. Note that the amount of protein loaded for the leaf samples is 7-fold higher than that of the corresponding samples from flowers and pollen.

