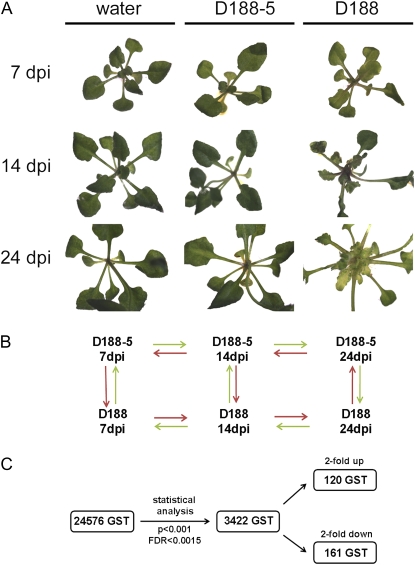
Figure 1.
Sampling, setup, and analysis of microarray hybridizations of Arabidopsis plants infected with R. fascians D188-5 and D188. A, Phenotype at the selected time points. Roots, cotyledons, and leaves were removed for sampling. B, Experimental setup in a loop design for the 14 hybridizations. The dye swaps were combined with the two biological replicates. C, Flow chart representing the outcome of the statistical analysis of the microarray data.

