Figure 3.
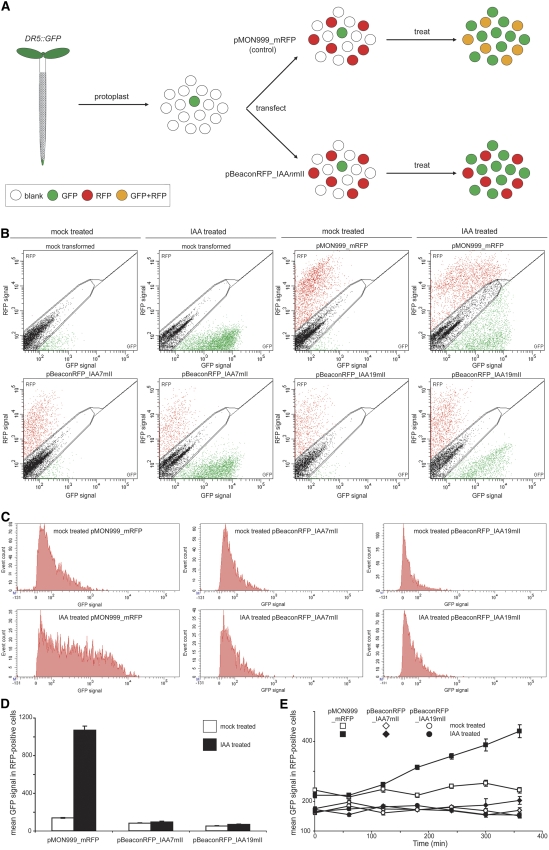
Repression of DR5∷GFP activation by IAA7mII and IAA19mII. A, A schematic representation of the experiment. Protoplasts derived from the roots of 1-week-old DR5∷GFP Arabidopsis seedlings were transfected with either pMON999_mRFP, expressing only mRFP, or pBeaconRFP, expressing IAA7mII or IAA19mII. After an overnight incubation, protoplast suspensions were treated for 10 h with 5 μm IAA or solvent alone. B, Flow cytometric analysis of transfected and treated protoplast suspensions. The GFP and RFP intensities for individual protoplasts were recorded and are represented in dot plots; 10,000 events are displayed in each plot. Gates were defined to separate blank, GFP-positive, and RFP-positive events. C, A frequency distribution of the GFP signal of events falling within the RFP gate in B. D, Quantification of the mean GFP signal in RFP-positive cells for auxin- and mock-treated protoplasts transformed with the control vector or pBeaconRFP with IAA7mII or IAA19mII. Data are presented in a histogram ± se (n = 798–2,447). E, A 6-h time course of GFP quantification in an independent experiment. Data are presented in a line graph ± se (n = 579–2,390).

