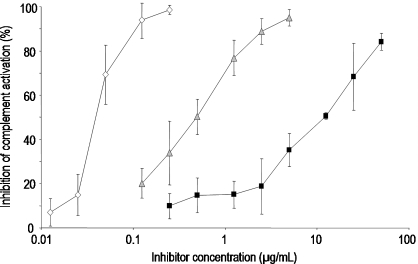
Fig. 3.
Concentration-dependent inhibition curves for the inhibition of complement activation by ▪ UFH,  PS3, and ⋄ D.s.-SP, concentrations given in μg/mL. All standard deviations are derived from assays performed on at least three different days. Calculated IC50 values differ significantly (P ≤ 0.05) for every pair of inhibitors.

