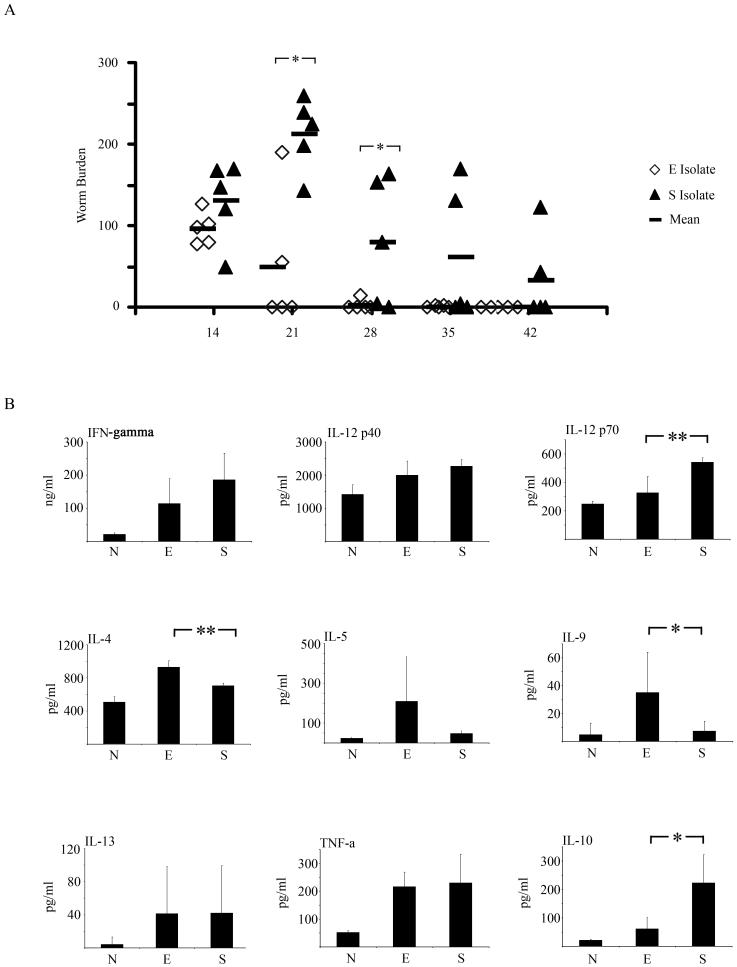
Figure 1.
Time course of an E and S isolate infection in C57BL/6 mice. A. C57BL/6 mice were infected with 150-200 embryonated eggs from either the E or the S isolate of T. muris. At various time points post-infection (p.i), the mice were sacrificed, caecae and proximal colons were removed and the number of worms counted. Each symbol represents an individual animal (5 mice per group) and the line represents the mean. B. Levels of IFN-γ, IL-12p40, IL-12p70, IL-4, IL-5, IL-9, IL-13, TNF- α and IL-10 in MLN supernatants were measured by CBA following MLN re -stimulation with parasite specific E/S; all cytokine data are pg/ml (B). Values represent the mean ± SD for five mice per group and were analysed at d21 p.i. *, significant difference between the E isolate and S isolate infected mice (Mann Whitney U test,*= p<0.05, **=p<0.01).

