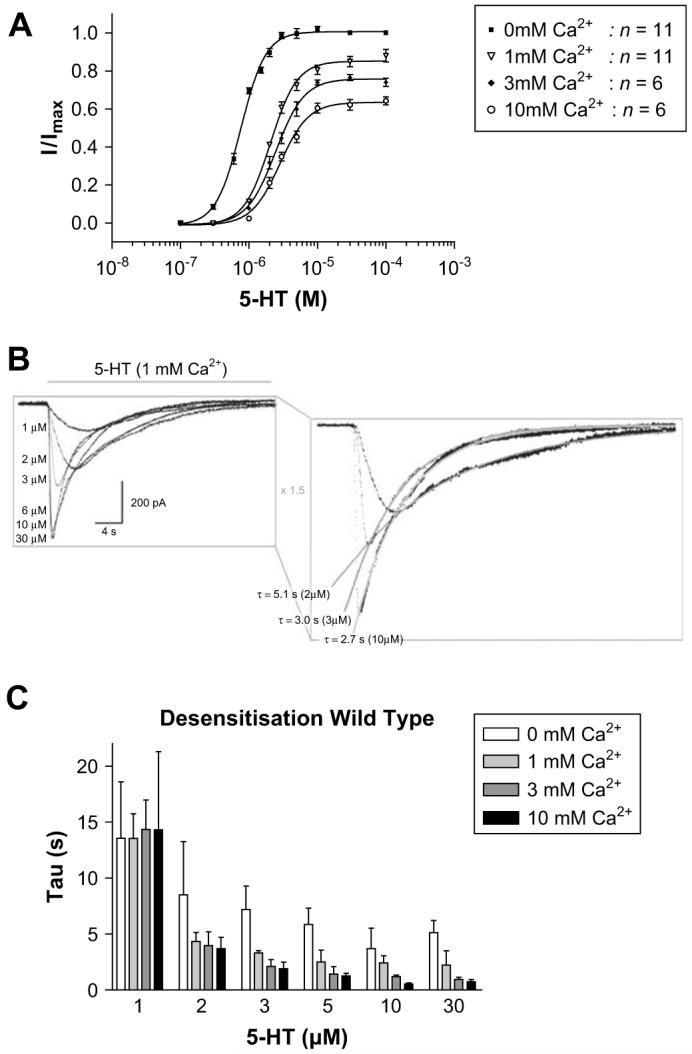
Fig. 2.

Wild type responses in the absence or presence of increasing concentrations of external calcium. Dose-response curves (A) displayed a calcium associated decrease in the peak current amplitude and the curves were shifted to higher 5-HT concentrations. (B) Example 5-HT3 receptor responses to varying concentrations of 5-HT and calcium. Current traces in response to varying concentrations of 5-HT (grey bar) in the presence of 1 mM calcium are shown (B, left), with exponential fits of desensitisation for the 2 μM, 3 μM and 10 μM 5-HT responses (B, right). The rate of desensitisation (C) increased as 5-HT concentrations were raised, and displayed additional increases in the presence of calcium. Values for desensitisation are mean ± SEM, n > 5.
