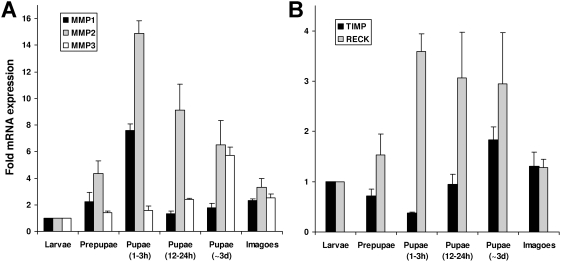
Figure 6. Quantitative real time RT-PCR analysis of transcriptional levels of Tribolium MMPs during metamorphosis.
(A) The mRNA levels of MMP-1 (black bars), MMP-2 (gray bars), and MMP-3 (white bars) of different metamorphosis stages is shown relative to their expression levels in last instar larvae. Expression rates of MMP-1 increased 4-fold during prepupal stage and 8-fold during early pupal stage (1–3 h) and declined soon after this to basal levels. In contrast, MMP-2 mRNA levels were determined to be elevated at all analyzed prepupal and pupal stages with the highest elevation (15-fold) at the early pupal stage when compared to larval stage. Interestingly, MMP-3 expression levels were not induced during early stages but in a later stage of metamorphosis. In 3 day old pupae, we determined a 6-fold elevated transcript level. (B) TIMP gene expression was repressed 2-fold in early metamorphosis and induced in later stages, whereas RECK gene expression was induced during all tested stages of metamorphosis. Expression levels of MMP-4 (Glean 10983) and 18S rRNA genes were not significantly different at all analyzed stages (data not shown). Results represent mean values of three independent determinations±S.D. from ten animals per stage that were pooled for analysis.

