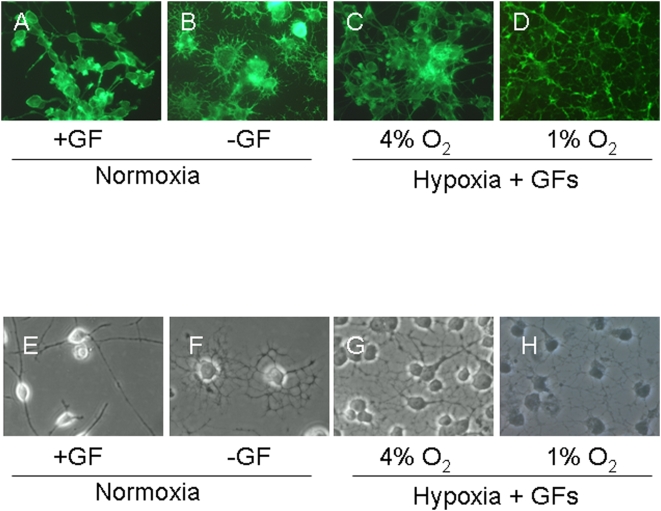
Figure 7. Changes in OL morphology in hypoxia.
OLs were cultured in 21% O2 in the presence of GFs (A, E), in the absence of GFs (B, F), or under with GFs in 4% O2 (C, G) or 1% O2 (D, H) for 1 week. Fluorescence images of cells stained with actin-specific phalloidin (A–D) and phase-contrast images (E–H) of OLs show that cultures deprived of GFs (B, F) or cultures exposed to hypoxia (C, D, G, H) undergo morphological changes consistent with enhanced maturation. Scale bars = 10 um. Data shown are representative of five separate studies. At least ten separate coverslips were analyzed per study.

