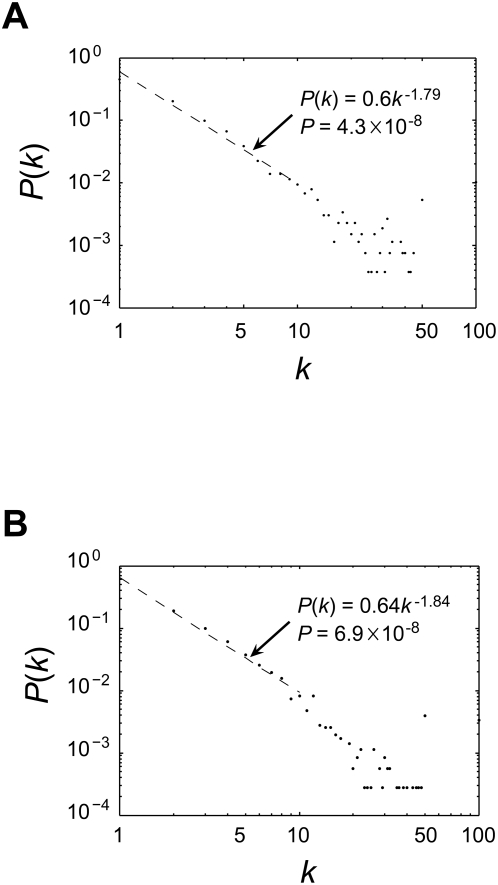
Figure 3. The power-law distribution of productivity per study for (A) PPIs and (B) GIs.
The dotted line shows the fitting for k≤10, which includes ∼93% and ∼96% of considered publications for PPIs and GIs, respectively. Publications with k from 50 to 99 were lumped together and plotted at k = 50, and publications with k≥100 were lumped together and plotted at k = 100.

