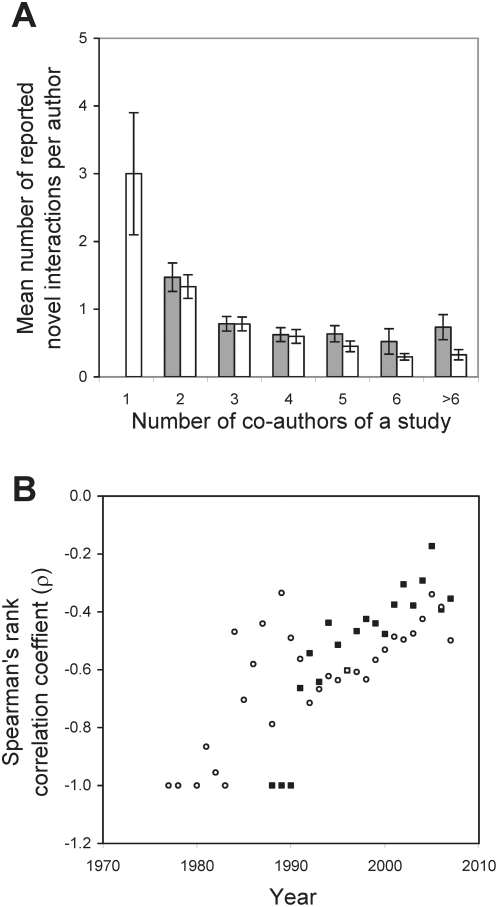
Figure 5. Mean number of novel PPIs (grey bars) or GIs (white bars) discovered per author in a study reduces as the number of co-authors of the study increases for the papers published in any given year.
(A) Results from year-1998 are shown here as an example (n = 210 papers, Spearman's rank correlation ρ = −0.424, P = 1.4×10⁻¹⁰ for PPIs; n = 273 papers, ρ = −0.634, P<10−15 for GIs). Error bars show one standard error. (B) All years show a negative rank correlation (ρ) between the number of novel PPIs (black squares) or GIs (white circles) reported per author in a study and the number of co-authors of the study. Statistical significance of the correlations can be found in Table S2.

