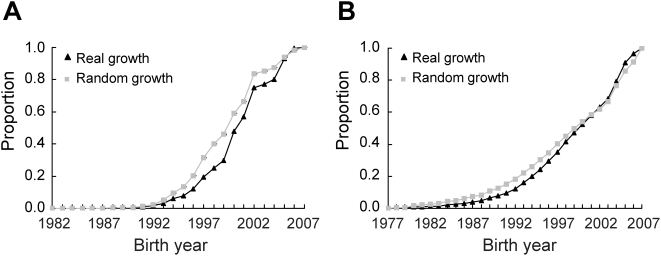
Figure 7. Reduced rates of discovery of new genes in the real growths of (A) the PPI network and (B) GI network, compared to the random growths.
Shown on the Y-axis is the proportion of genes in the year-2007 network that were present in an earlier year. For the simulated random growth, the mean of 1000 replications is presented; the standard error is too small to see for all data points.

