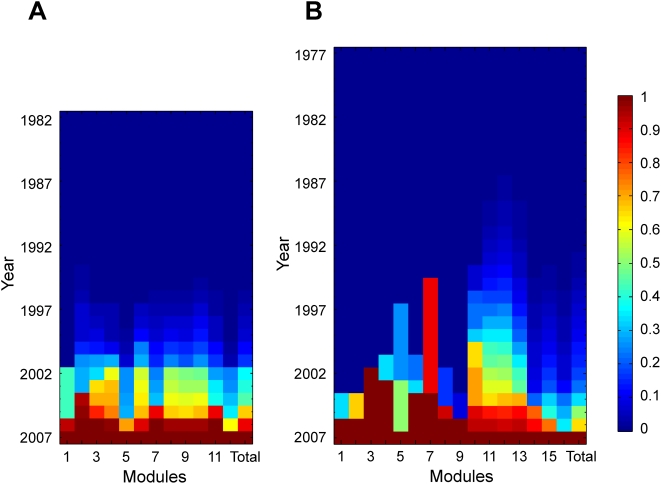
Figure 10. Different maturation status of different modules during the growths of the (A) PPI and (B) GI networks.
The last column designated as “Total” in each panel shows the maturation status of the entire network. Color shows the maturation status, or completeness, of the growth of each module. All modules completed their growth at 2007, and thus are 100% completed in the bottom row.

