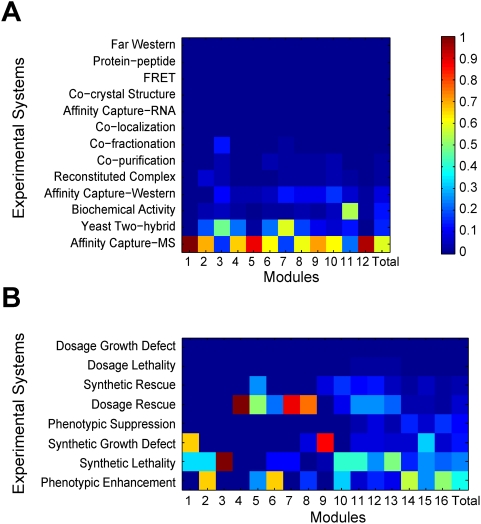
Figure 13. Interactions identified through different experimental systems are unevenly distributed among modules of the (A) PPI and (B) GI networks.
The last column designated as “Total” in each panel shows the relative contribution of different experimental systems to the whole network. Note that since only novel interactions are considered and there is usually only one method in each publication, there is no novel interaction that was revealed by two methods in our analysis. Each module can be represented by a “method” vector, with each component of the vector being the fraction of interactions in the module that are discovered by each method. To examine how nonrandom different methods are in discovering interactions in different modules, we simulated the scenario in which all network modules are equally amenable to an experimental method, by randomizing the relationship between an interaction and the method used for its discovery. We calculated the total Euclidean distance between the method vectors of all pairs of modules. We conducted 1000 simulations for both PPI and GI networks, and the obtained Euclidean distances are 3.45±0.63 and 52.9±5.15, respectively. These distances are significantly (P<0.001) smaller than the observed distances in real networks (29.6 for PPI and 87.4 for GI).

