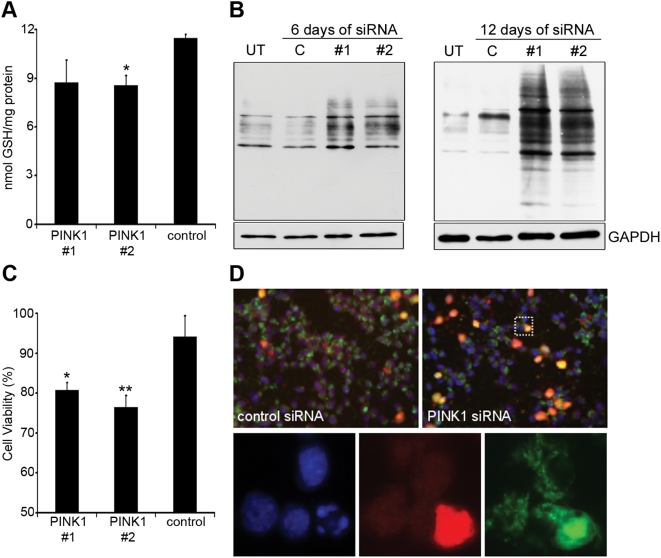
Figure 4. Oxidative stress and cell death in PINK1 silenced cells.
SH-SY5Y cells were treated with PINK1 or scrambled control siRNA for 12 days. A, reduced glutathione was measured by reverse-phase high performance liquid chromatography. Data are expressed against protein and are the mean±s.e.m. (n = 4). B, the carbonylation of protein residues following PINK1 silencing (#1, #2), or in untreated cells (UT), or cells treated with control siRNA (C), was determined by Oxyblot. Cells were treated with siRNA for either 6 or 12 days. Loading of Triton X-100 cell lysates was assessed by re-probing the western blot with GAPDH antibody. C, cell death was measured in siRNA-treated cells by the Cell Titer-Blue assay following treatment with 0.5 mM paraquat for 24 hours. Data are expressed as percentage of fluorescence of vehicle-treated cells grown in sister wells (n = 6). D, immunofluorescence of cells following treatment with 0.5 mM paraquat for 24 hours. Cells probed for active caspase-3 (red) and cytochrome-c (green). Cell nuclei were counterstained with DAPI (blue). The inset is shown below. * P<0.05; ** P<0.01 vs. scrambled control siRNA.

