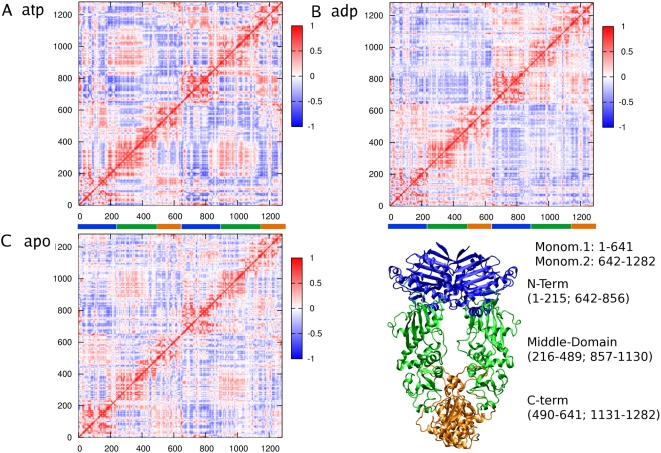
Figure 4. Cross-Correlation matrices calculated considering the motion of Cα atoms around the average position.
A) Cross-Correlation Matrix for the Hsp90-ATP complex; B) Cross-Correlation Matrix for the Hsp90-ADP complex; C) Cross-Correlation Matrix for apo Hsp90. A correlation close to 1 (color code: yellow) corresponds to highly coordinated motion of the atom pair along the same direction, whereas a negative correlation (color code: blue) indicates motion in opposite directions. The 3D structure of the full-length Hsp90 is reported for reference, with the different domains highlighted in different colours: blue, N-terminal domain; green, M-Domain; orange, C-Domain.

