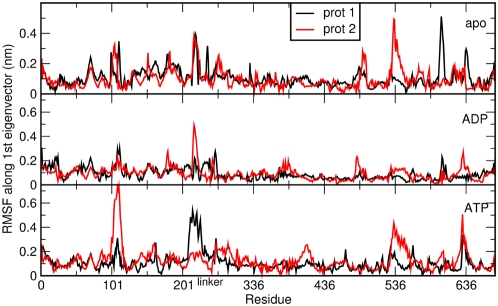
Figure 9. The average residue fluctuations projected on the main ED eigenvector.
This quantity is calculated by projecting the trajectory over the first eigenvector according to the ED analysis. For each simulation, the two protomers (each spanning residues 1–677) forming the dimer are plotted on the same graph. From top to bottom: apo, ADP and ATP simulation.

