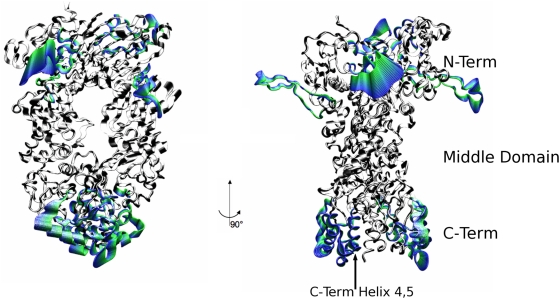
Figure 10. Structural analysis of the ATP-bound Hsp90.
Different consecutive snapshots from the MD trajectory in the ATP simulation are projected along the main ED eigenvector and their structures superimposed. Regions undergoing relevant correlated motions are highlighted in colors; they involve the ATP lid of both protomers and helices 3 at the CTDs. The color code from green to blue reflects the time evolution of the trajectory.

