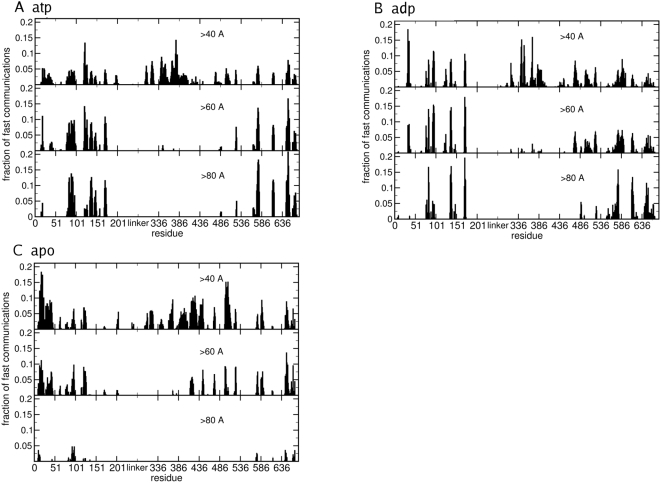
Figure 12. The histogram analysis of the communication efficiency.
(A) The histogram for the Hsp90-ATP complex; (B) The histogram for the Hsp90-ADP complex; (C) The histogram for apo Hsp90. Each bin refers to a residue and shows the fraction of residues of the whole protein that are highly prone to communicate with it, i.e. such that their pair CP value is below 0.025. In each histogram only communications at distances greater than a given threshold are considered, namely over 40, over 60 and over 80 Angstroms.

