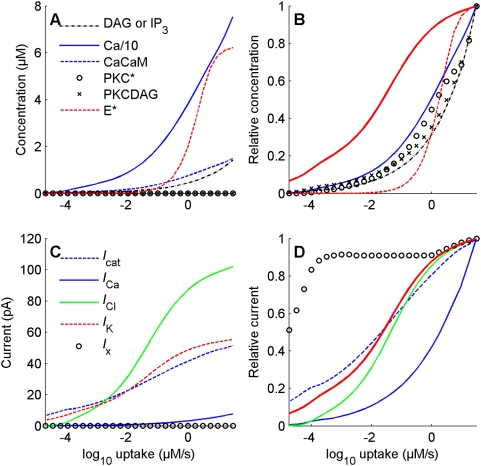
Figure 9. Comparison of dose-response curves for height of the chemical species and currents.
Height (left column; see definition in Figure 8D) and relative height (right column) for chemical species (top row) and for depolarizing and repolarizing currents (bottom row). (A) Ca2+ (solid blue line) is the most abundant species (concentration divided 10 fold to be shown on the same scale as other species). (B) Responsiveness of all chemical species is much smaller than that of SP (curves shifted to the right of the SP curve shown as a solid red line), larger than that of effector enzyme E* (dashed red line) at low doses and smaller than E* at high doses. (C) Cl− (solid green), K+ (dashed red) and cationic (dashed blue) currents are the most intense currents. (D) Responsiveness of the Cl− and cationic currents is higher than that of the effector enzyme (cf. (B)) and the IP3-gated Ca2+ current (solid blue). In particular, the cationic current curve is close to that of SP (solid red curve, same as in B) and K+ (confounded with SP) at all doses, while the curve of the Cl− current (solid green) is on the right of the SP curve at low doses (smaller responsiveness) and close to it at high doses.

