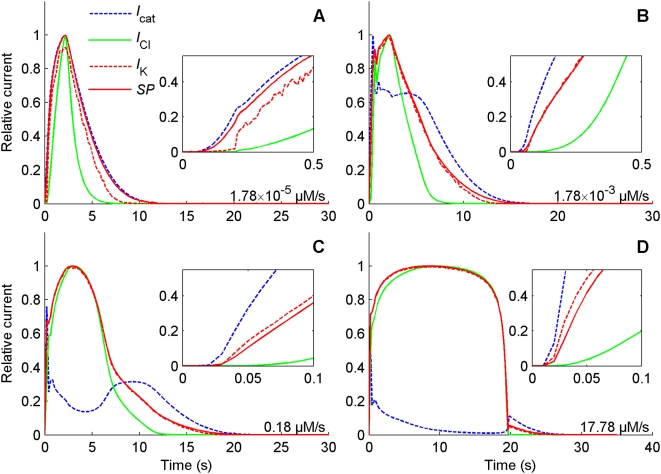
Figure 11. Normalized kinetics of the major currents and SP.
Same as Figure 10 except that currents and SP have been normalized with respect to their maxima for easier comparison of the rising and falling phases. At all doses, (A) 1.78×10⁻⁵, (B) 1.78×10⁻³, (C) 0.178 and (D) 17.8 µM/s, the DAG-gated cationic current I cat (dashed blue) rises faster than the K+ current I K (dashed red) and the Cl− current I Cl (solid green), and I K closely follows I Cl at intermediate and high uptakes.

