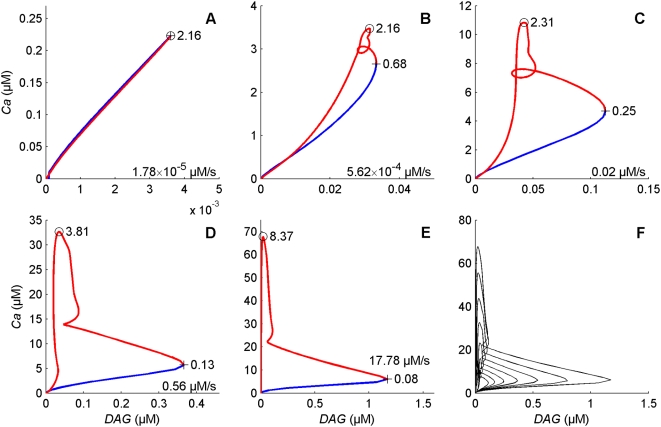
Figure 12. Phase portraits on the DAG-Ca2+ plane at different pheromone uptakes.
(A) 1.78×10⁻⁵, (B) 5.62×10⁻⁴, (C) 0.02, (D) 0.56 and (E) 17.78 µM/s. (F) Superimposition of the phase portraits for 15 stimuli from low to high uptakes. Uptakes are regularly separated by 1.5 log units, i.e. multiplied by 31.6 from one portrait to the next. The starting point at t = 0 is close to the origin (0, 10−3). The blue and red lines correspond to the rising and falling phases of DAG, respectively. The times at which DAG (cross) and Ca2+ (circle) reach their respective maxima are indicated (in s). Uptakes are regularly separated by 1.5 log units, i.e. multiplied by 31.6 from one portrait to the next.

